In the first half of 2020, due to the epidemic, everyone's work and life were suspended, but we did not stop. The 2019 carbon accounting report of International Campus, Zhejiang University came a bit late, but here it is, we are never absent.
International Campus, Zhejiang University has established the concept of sustainable campus development since its inception. In order to promote sustainable campus operations and allow more teachers and students to pay attention to climate change, office of campus development and management took the lead in preparing the 2019 carbon emission accounting report of the International Campus.
Basic situation on campus
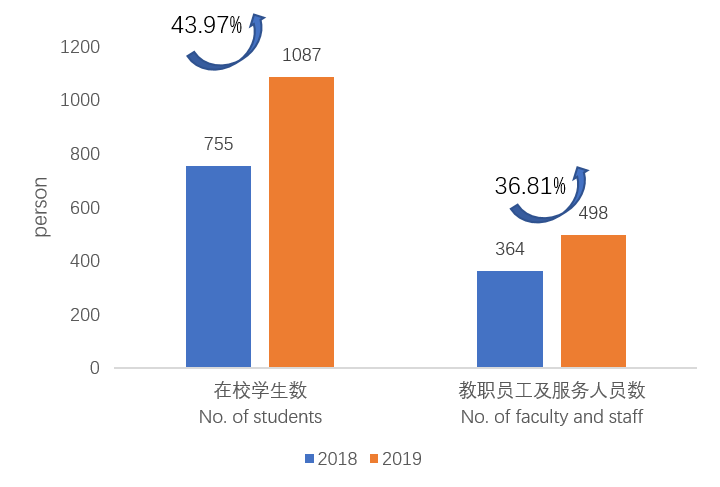
The International Campus covers an area of 666,700 square meters. As of December 2019, the campus has a construction area of 296,700 square meters, with an increase of 86.84% over 2018. There are 1087 students in campus, with an increase of 43.97% over 2018, and 498 faculty and staff, with an increase of 36.81% over 2018.
Total Campus Carbon Emission (Greenhouse Gas Emission)
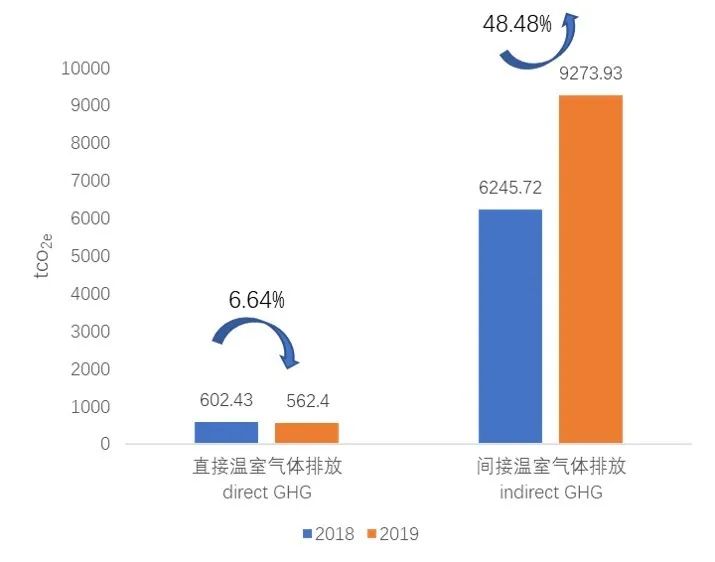
GHG emission on International Campus in 2019 was equivalent to CO2e 9832.6 tons. The direct GHG CO2e was 562.4 tons, which had decreased 6.64% compared to 2018, including sources such as natural gas of canteen, teaching and learning buildings, scientific research buildings, and diesel and gasoline consumed in the shuttle buses. The indirect GHG CO2e was mainly from purchased electricity, about 9273.93 tons, which increased 48.48% compared to 2018.
International Campus Carbon Emission Intensity
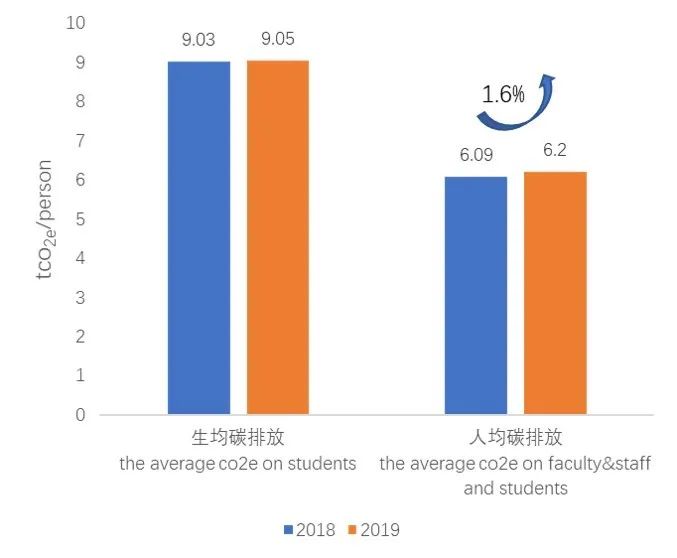
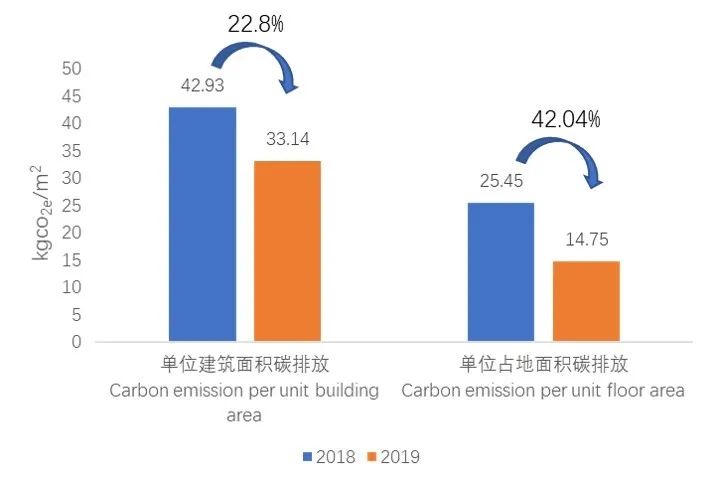
In 2019, the average CO2e was 9.05t on students, which was the same as in 2018, and the average CO2e was 6.20t on all persons in campus which increased 1.6% from 2018. The carbon emission per unit building area equivalent to the campus building area was 33.14kgCO2e/m2, which decreased by 22.8% compared to 2018 and per square meter of floor area was 25.45kg which decreased by 42.04% compared to 2018.
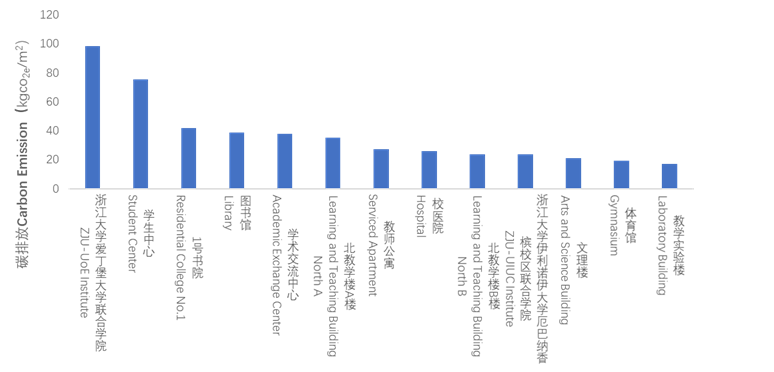
Carbon Emission Intensity on Key Buildings
Buildings contributed most to total energy consumption and average carbon emission of campus construction has been reported, which occupies 68.5% of total carbon emission. The average floor area carbon emission intensity of the key buildings was 36.98kgCO2e /m2.
Calculate your carbon footprint
Carbon emissions are closely related to each of us. Daily work, study and life will produce a lot of carbon consumption. To reduce carbon usage, let's learn about the "carbon footprint" and record our daily carbon emissions.
https://www.intl.zju.edu.cn/sc/zh-hans/sustainable_campus/carbon-footprint
For full carbon emission report
To view a more comprehensive campus carbon emissions data, please log on to the Sustainable Campus website of the International Campus, Zhejiang University (https://www.intl.zju.edu.cn/sc/zh-hans) to download report.